strategic business function — a discipline that improves confidence, budget planning, and decision-making.we dive deeper into how engineering converts that strategy into reliable, quantifiable estimates. This is where structured models, technical decomposition, risk scores, and team capacity transform assumptions into practical delivery timelines.This article explains how organizations move from high-level ROM estimates to precise engineering forecasts.

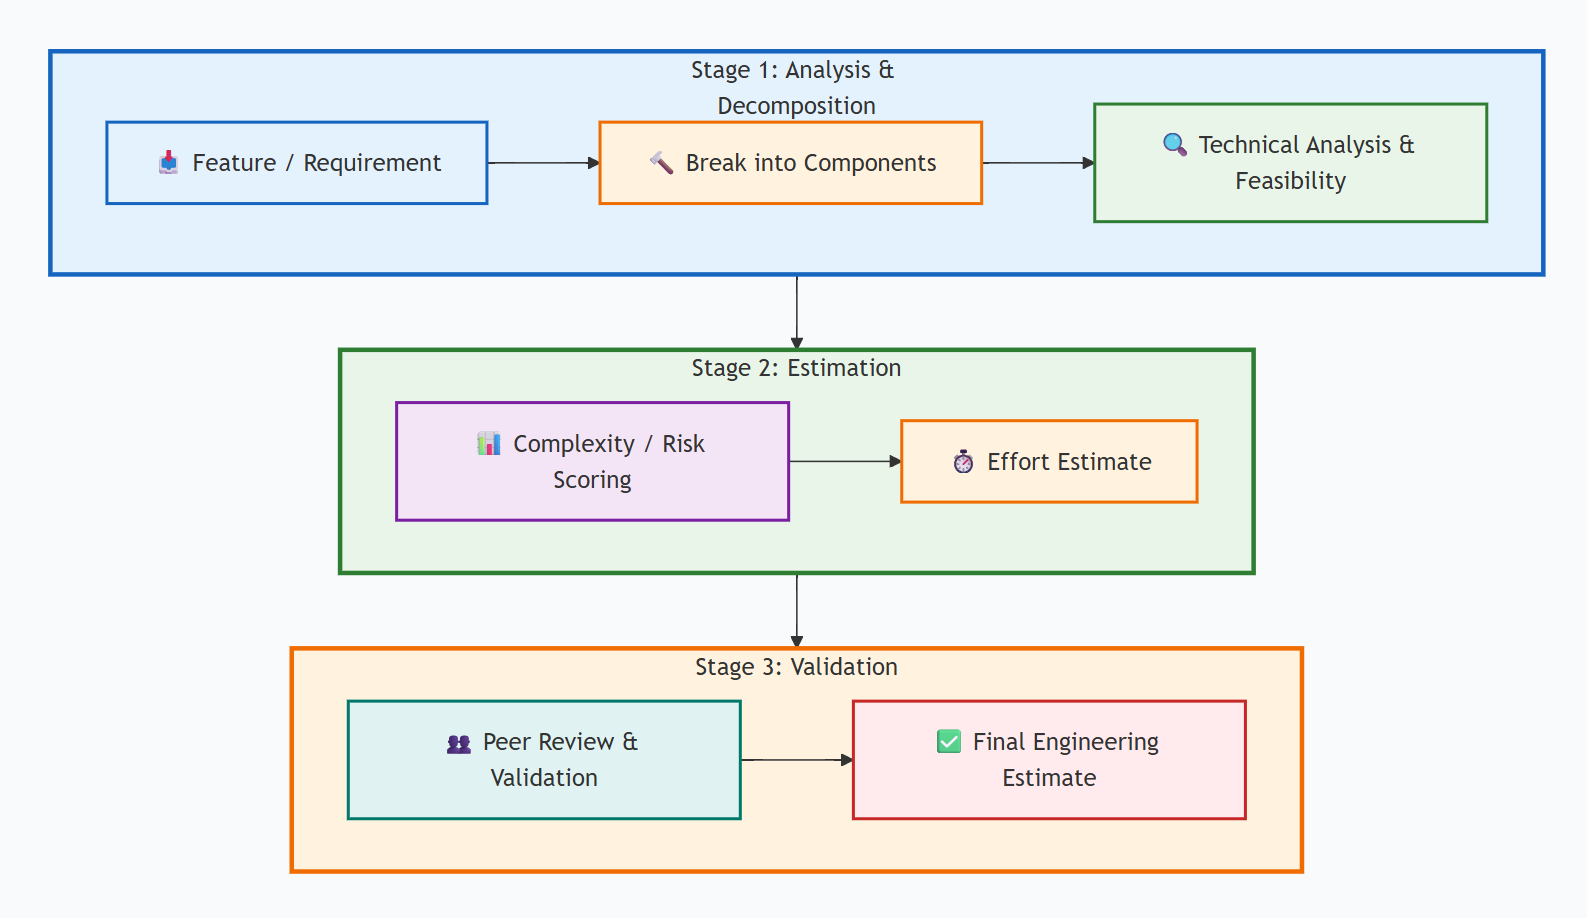
1. Engineering Estimation is a System, Not a Guess
Business leaders often see estimation as a “timeline”, but for engineering teams, estimation is a calculated pipeline involving:
requirement decomposition
complexity scoring
technical feasibility checks
dependency mapping
capacity-based duration calculation
risk multipliers
validation loops
Project Information
Client:
Maurizio
Location:
Canada
Project duration:
3 -6 Months
Technologies used:
Nextjs, Nestjs
Website:
https://arcadiaacademyofmusic.com/
2. The Engineering Decomposition Model (WBS)
A Work Breakdown Structure (WBS) is one of the most reliable ways to produce a consistent estimation baseline.
Instead of estimating “a feature”, engineers break it down into small, measurable units of work:
Example WBS for a Feature: “Student Attendance Module”
| Level | Task Type | Explanation |
|---|---|---|
| 1 | Feature | Attendance Module |
| 2 | Sub-Module | Teacher view, student view, API |
| 3 | Tasks | UI form, API endpoint, validation |
| 4 | Subtasks | DB query, cache logic, test cases |
The smaller the task → the more accurate the estimate.
This moves estimation from abstract to quantifiable.
3. Engineering Estimation Techniques
1. Bottom-Up Estimation
Engineers estimate individual tasks, then combine them:
API development: 4 hours
DB schema changes: 3 hours
Validation logic: 2 hours
Tests: 2 hours
Reviews: 2 hours
Total = 13 hours
Bottom-up is the most accurate method for fixed-scope delivery.
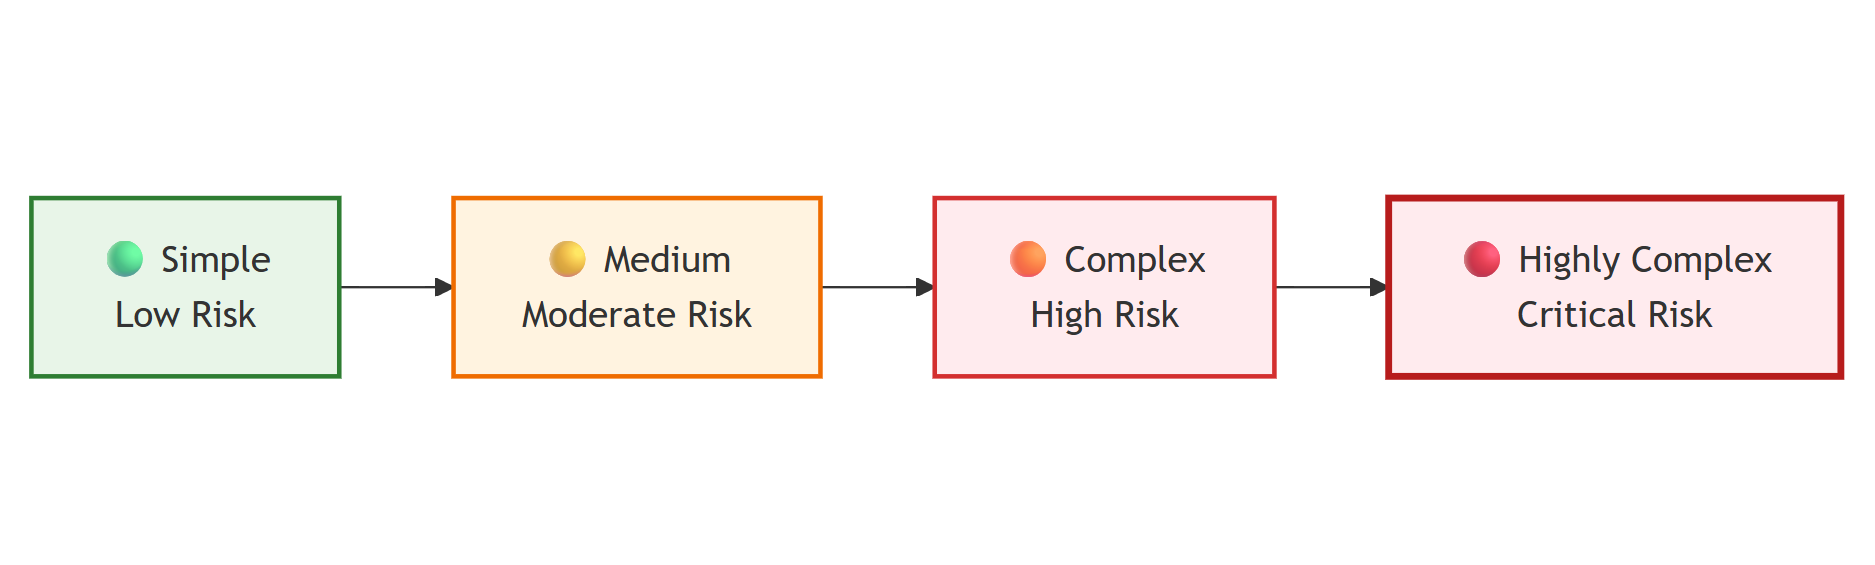
2.Complexity-Based Scoring
Tasks are evaluated using attributes like:
logic complexity
number of integrations
state management difficulty
data dependencies
performance requirements
refactoring effort
A simple scoring model:
Each level maps to an estimated effort range.
3. Risk-Adjusted Estimation
Risk is one of the most underestimated variables.
Risk factors include:
unclear requirements
legacy system dependencies
third-party APIs
new technology
performance bottlenecks
security constraints
We apply a dynamic buffer:
Adjusted Estimate = Base Effort + (Base Effort × RiskScore)
If RiskScore = 0.2 (20%) → add 20% time
If RiskScore = 0.4 (40%) → add 40% time
This prevents timeline failures caused by unknowns.
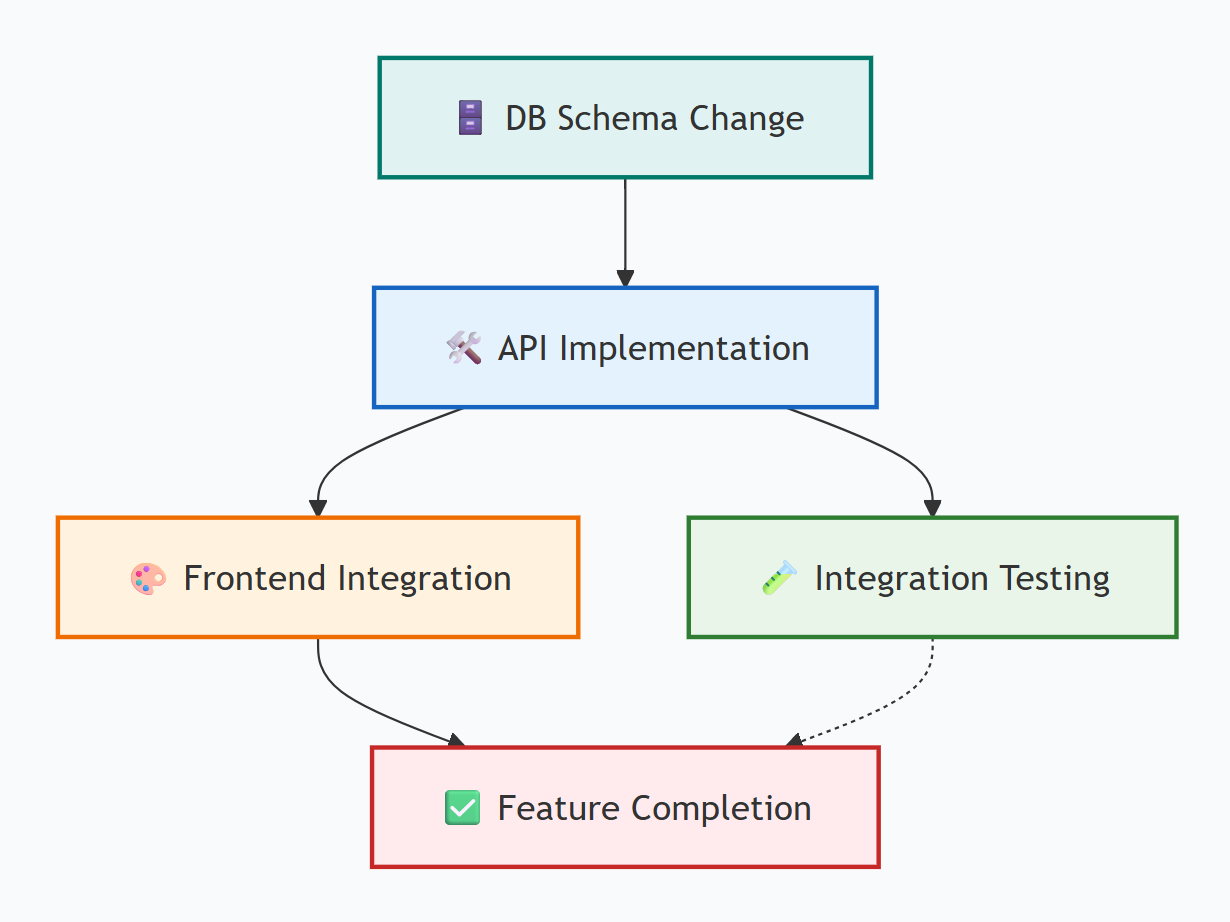
4. Technical Dependency Mapping (Critical Path Analysis)
Many delays occur not because tasks are hard, but because they are dependent on others.
Any delay in early tasks affects all downstream tasks.
This is the critical path — the chain that determines the delivery date.
Understanding dependencies helps engineering leaders:
optimize sequencing
identify bottlenecks
allocate resources smarter
negotiate scope with clarity
5. Using Team Capacity to Predict Timelines
Effort ≠ timeline. A team may estimate: 100 hours of work But the timeline depends on how many effective hours the team can deliver weekly.
6. Cross-Discipline Estimation Breakdown
Engineering estimation covers more than development:
APIs
DB queries
services
caching logic
unit tests
integration tests
UAT fixes
environment setup
deployment pipelines
CI/CD
input sanitization
data protection
permission checks
API contracts
module behavior
onboarding notes
Each contributes to the final effort.
7. The “Effort Layer Model” — Engineering’s Internal View
This model ensures estimates include not just coding, but the entire delivery lifecycle.
8. Tiny Code Example (Only One) — Estimation Template
A simple JSON-like structure engineers use when estimating tasks:
    server {
listen 80;
server_name example.com;

location / {
proxy_pass http://localhost; # Angular
}

location /page1 {
proxy_pass http://localhost; # Angular
}

location /page2 {
proxy_pass http://react_app;
}

# Additional configurations for headers, static files, etc.
}
9. Review-Driven Validation Makes Estimates More Accurate
Great estimation isn’t done individually.
We use three layers of validation:
Peer review — developer-to-developer cross-check
Lead review — architectural correctness
Manager review — alignment with business timeline
This eliminates over-optimism and underestimation.
10. Turning Estimates into a Delivery Plan
Once engineering completes the technical estimation:
milestones
sprints
release plan
risk logs
dependency matrix
resource allocation
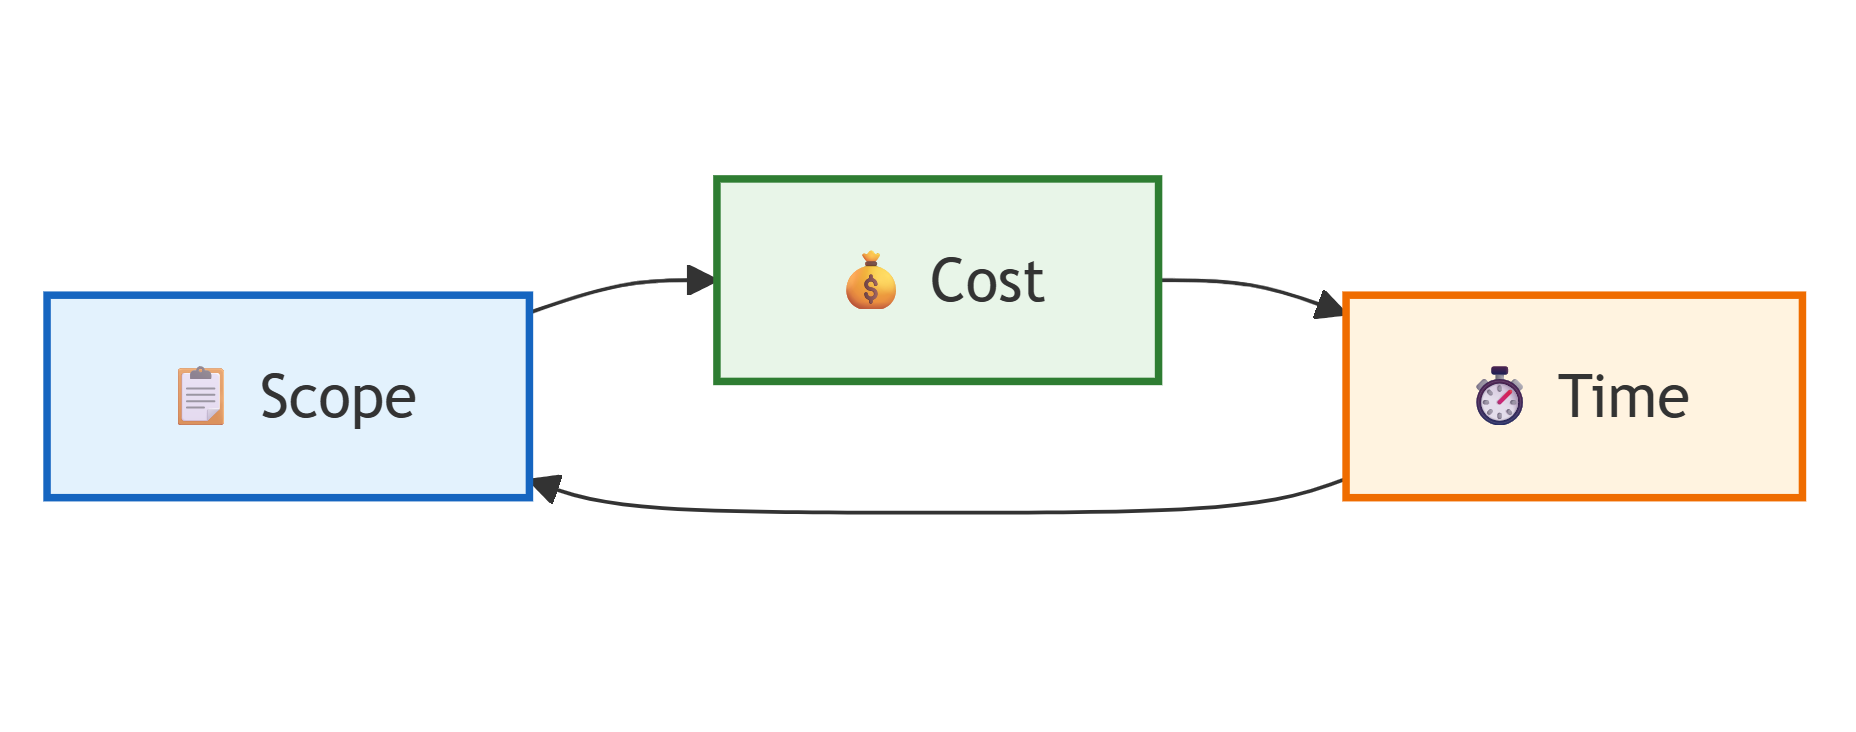
The business receives:
timeline
budget
scope clarity
Engineering receives:
a realistic sprint plan
a predictable workflow
transparent expectations
11. Final Outcome — Unified Predictability
- measurable
- repeatable
- accurate
- predictable
- risk-aware